The Yellowstone National Park climate chart provides essential information for visitors planning their trip to this iconic wilderness. With diverse weather patterns across seasons, the chart showcases average temperatures, precipitation levels, and seasonal variations. Understanding these climate trends is crucial for preparing adequately and maximizing the experience in America’s first national park.
What Does the Yellowstone National Park Climate Chart Reveal?

The Yellowstone National Park climate chart offers a wealth of information about the park’s weather patterns throughout the year. Here’s a breakdown of the key elements:
-
Average Monthly Temperatures: The chart displays both high and low temperatures for each month, giving visitors a clear idea of what to expect.
-
Seasonal Weather Trends: It illustrates how the climate shifts from the snowy winters to the mild summers, with transitional spring and fall seasons.
-
Precipitation Patterns: The chart may include data on rainfall and snowfall, crucial for understanding the park’s ecosystem and planning activities.
-
Extreme Weather Events: While averages are useful, the chart might also indicate the likelihood of extreme events like thunderstorms or heavy snowfall.
Let’s delve deeper into each of these aspects.
How Do Average Monthly Temperatures Fluctuate in Yellowstone?

The temperature variations in Yellowstone National Park are significant throughout the year. Here’s a detailed look at the average monthly temperatures:
| Month | Average High (°F) | Average Low (°F) |
|---|---|---|
| January | 24 | 1 |
| February | 27 | 2 |
| March | 37 | 9 |
| April | 44 | 19 |
| May | 51 | 28 |
| June | 62 | 35 |
| July | 72 | 40 |
| August | 72 | 38 |
| September | 62 | 31 |
| October | 48 | 23 |
| November | 33 | 12 |
| December | 24 | 3 |
As we can see, July and August are the warmest months, while December through February are the coldest. This temperature range affects various aspects of the park, from wildlife activity to visitor experiences.
What Are the Seasonal Weather Trends in Yellowstone?
Understanding seasonal weather trends is crucial for planning a visit to Yellowstone. Let’s break it down by season:
Spring (March to May)
- Temperatures range from 30°F to 60°F during the day
- Overnight lows can dip to single digits
- Unpredictable weather with a mix of snow, rain, and occasional warm days
- Slight increase in precipitation projected for the mid-21st century
Summer (June to August)
- Daytime temperatures often around 70°F, reaching 80°F at lower elevations
- Cool nights with temperatures potentially dropping below freezing at higher altitudes
- Afternoon thunderstorms are common
- Slight decrease in precipitation projected for the mid-21st century
Autumn (September to November)
- Daytime temperatures between 40°F to 60°F
- Overnight lows often below freezing
- Warm, dry days with cool, crisp nights
- Possibility of snow starting in September
Winter (December to February)
- Temperatures range from 0°F to 20°F throughout the day
- Sub-zero temperatures common at night and higher elevations
- Significant snowfall with an average of 150 inches annually
- Projected increase in winter precipitation for the mid-21st century
How Does Precipitation Vary in the Yellowstone National Park Climate Chart?
Precipitation patterns in Yellowstone National Park vary significantly across seasons and elevations. Here’s a breakdown:
-
Annual Snowfall: The park averages around 150 inches of snow per year, with higher elevations receiving up to 400 inches.
-
Spring Precipitation: Projected to increase slightly by mid-21st century, especially in higher elevation areas.
-
Summer Rainfall: Afternoon thunderstorms are common, but overall summer precipitation is expected to decrease slightly in the future.
-
Autumn Moisture: Slight changes projected, with increases in the southwestern portion of the park.
-
Winter Snowfall: Winter precipitation is expected to increase, particularly at higher elevations.
Understanding these patterns is crucial for visitors planning activities and for park management in maintaining the delicate ecosystem.
What Extreme Weather Events Are Common in Yellowstone?
While the Yellowstone National Park climate chart provides averages, it’s important to be aware of potential extreme weather events:
-
Spring Snowstorms: Significant snow accumulations of up to 12 inches in 24 hours can occur.
-
Summer Thunderstorms: Sudden, intense thunderstorms are common in the afternoons.
-
Early Autumn Snowfall: While infrequent, significant snowstorms can happen in late September or October.
-
Winter Cold Snaps: Extreme cold temperatures, sometimes dropping below -40°F, can occur.
-
Flash Floods: Rapid snowmelt or intense rainfall can lead to flash flooding in some areas.
Being prepared for these events is crucial for safety and enjoyment in the park.
How Does the Climate Chart Influence Visitor Activities in Yellowstone?
The Yellowstone National Park climate chart is an invaluable tool for planning your visit. Here’s how it can influence your activities:
-
Hiking and Camping: Best during summer months when temperatures are mild and trails are clear of snow.
-
Wildlife Viewing: Spring and fall offer great opportunities as animals are more active in cooler weather.
-
Winter Sports: Cross-country skiing and snowmobiling are popular from December to February.
-
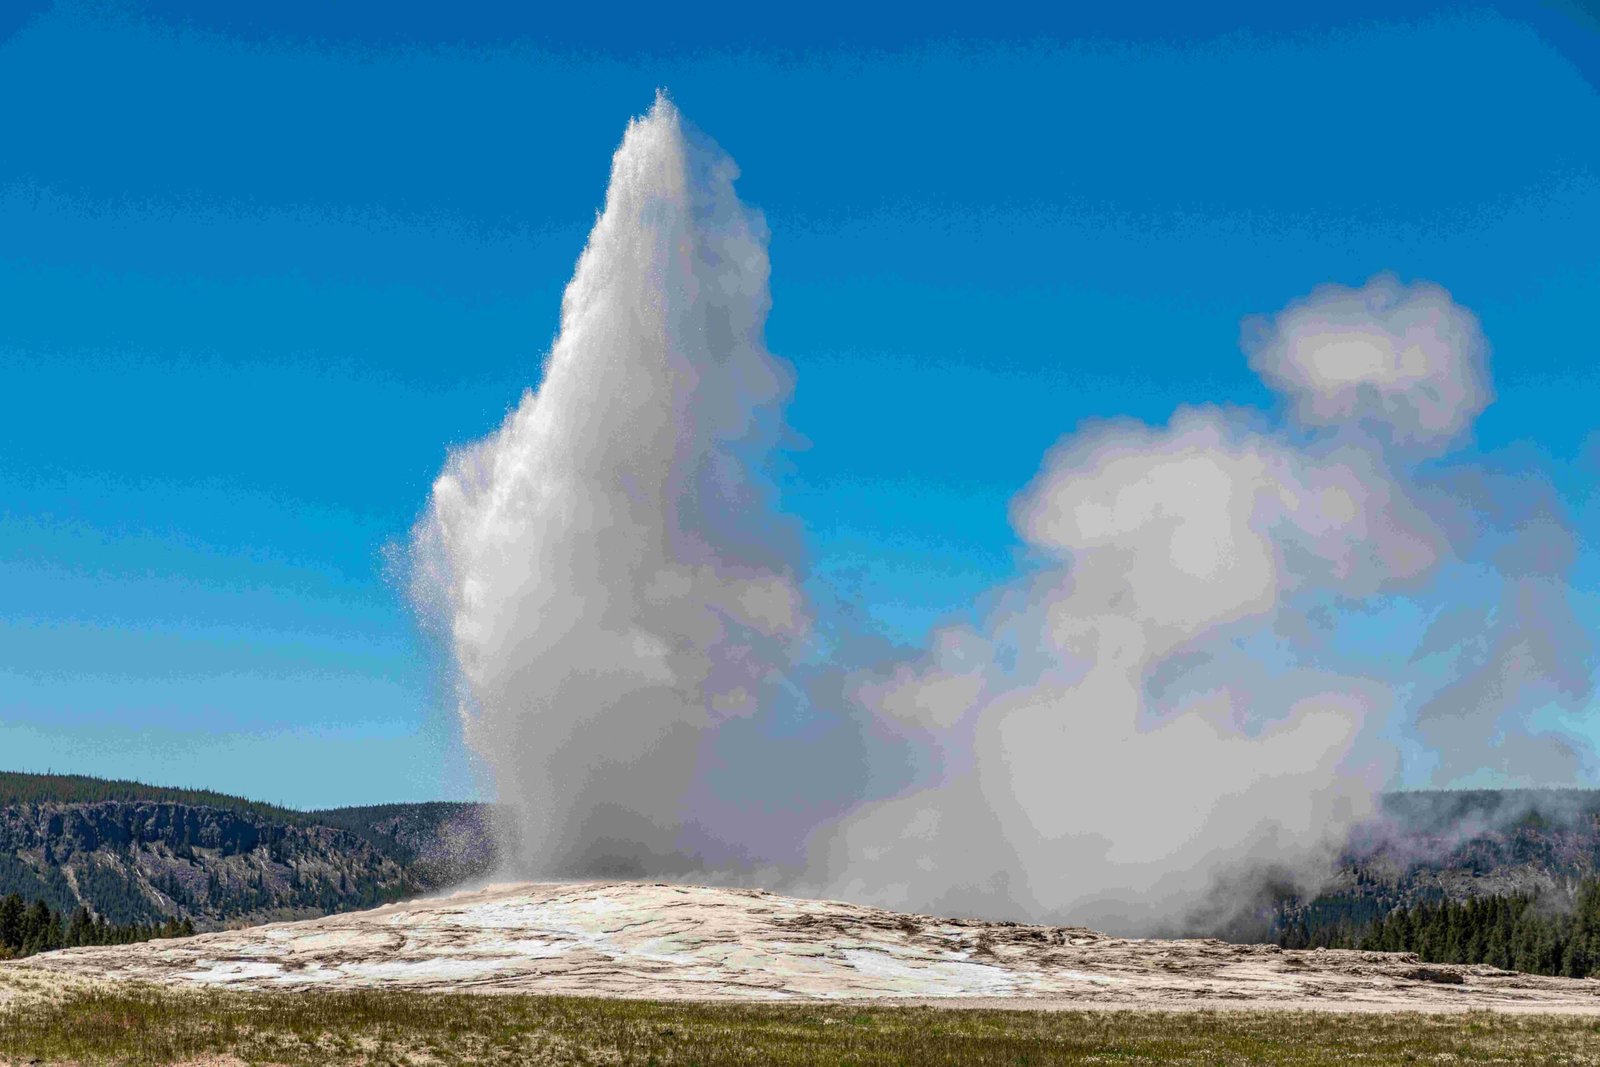
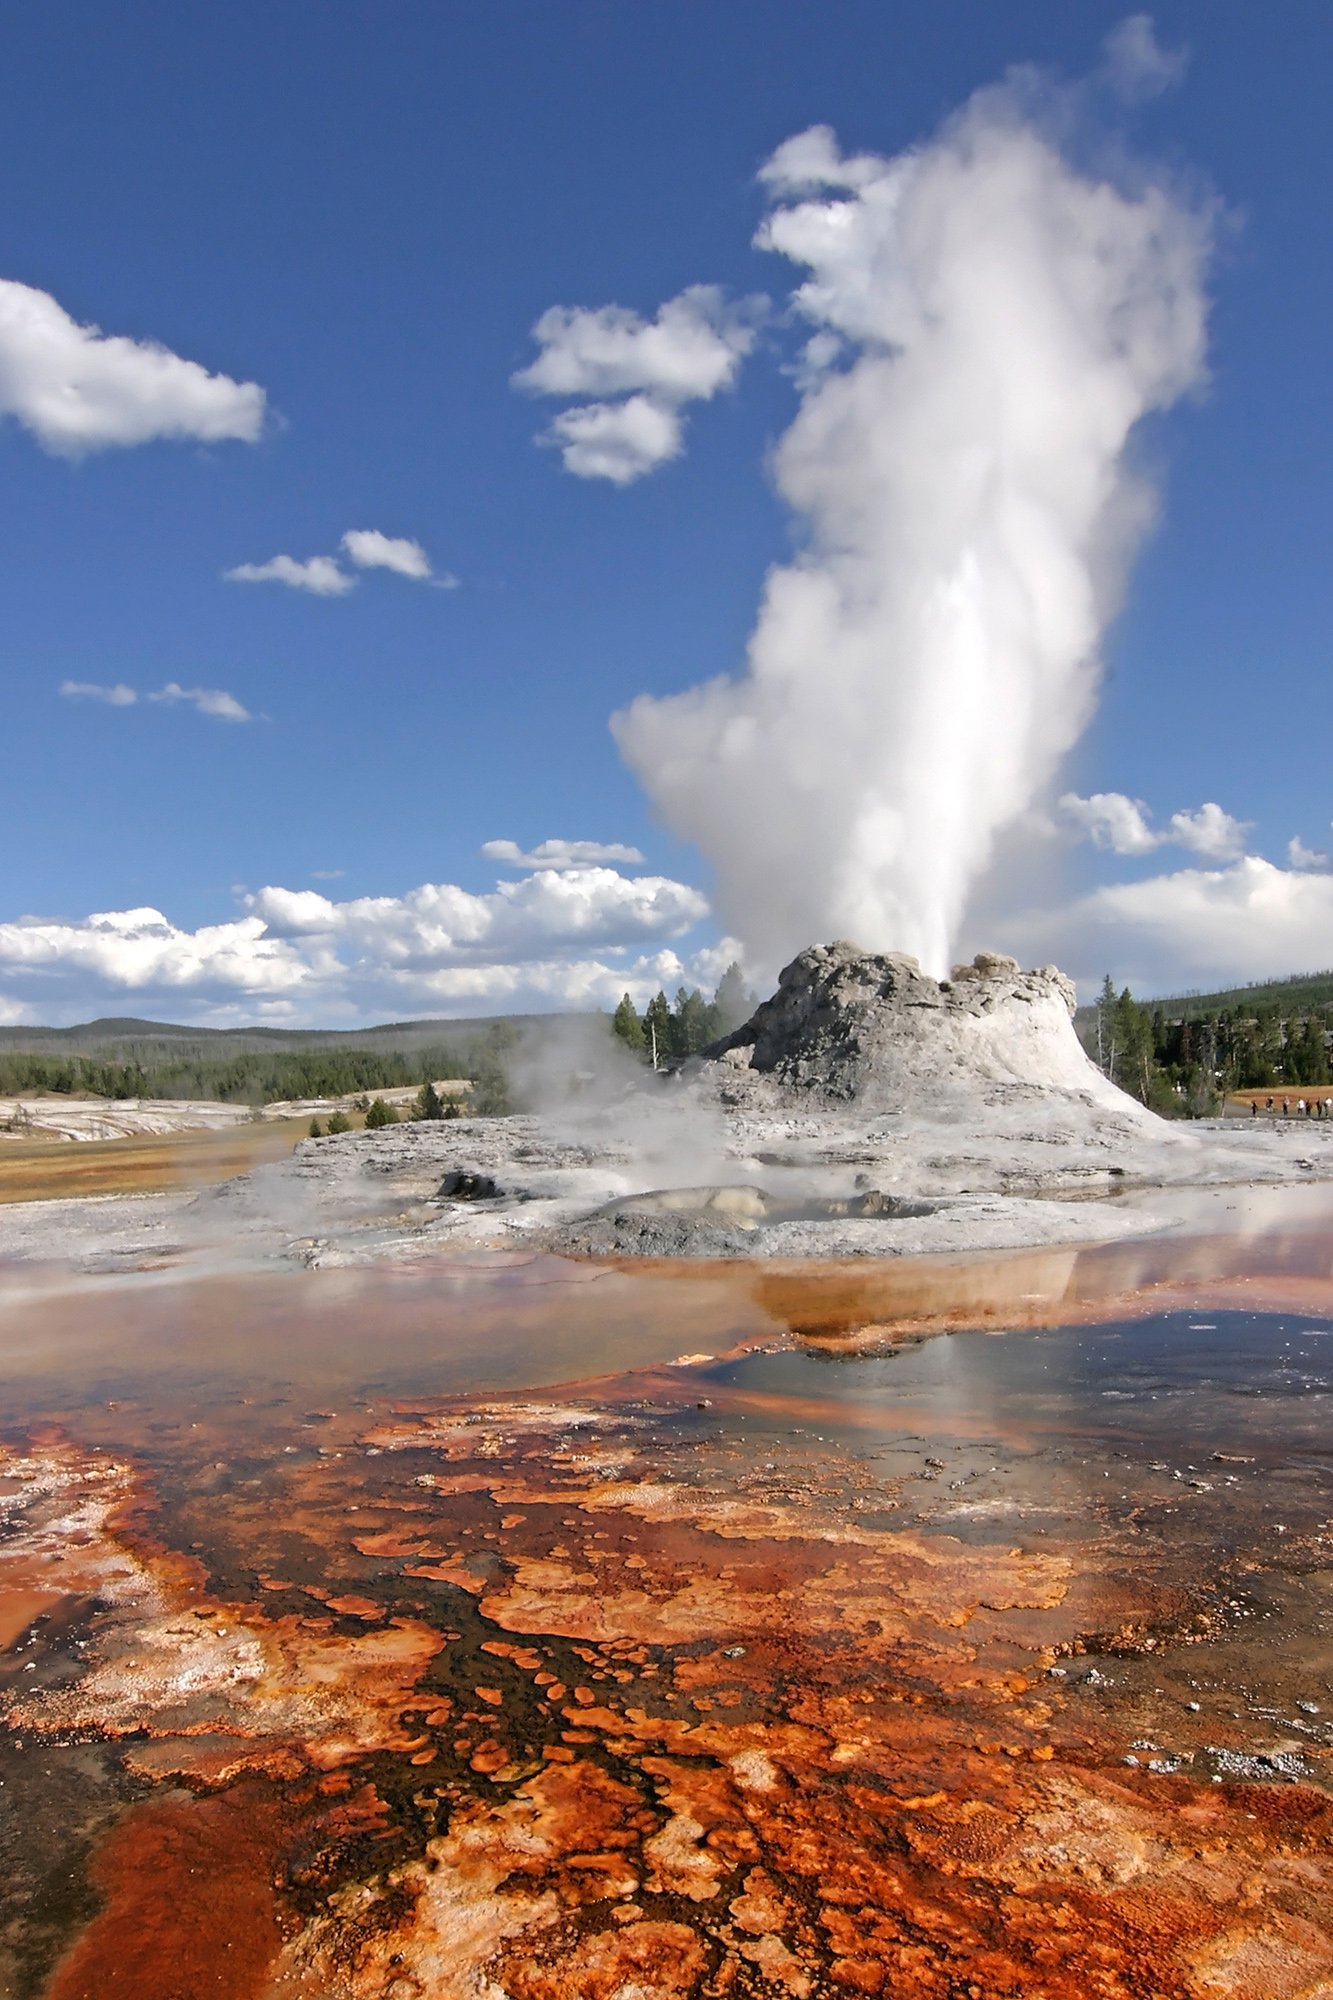
Geothermal Features: These can be viewed year-round, but winter offers a unique perspective with steam contrasting against the snow.
-
Scenic Drives: Fall is ideal for scenic drives with fewer crowds and beautiful foliage, but be prepared for potential snow.
Remember to always check current weather conditions and park alerts before your visit, as the climate chart provides averages and projections, not real-time data.
By understanding the Yellowstone National Park climate chart, visitors can better prepare for their adventure in this remarkable wilderness, ensuring a safe and memorable experience regardless of the season.

